
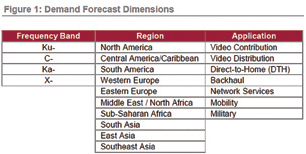
In August of this year, Futron released its most recent forecast of global supply and demand. Futron forecasts demand for Fixed Satellite Service (FSS) 36-MHz transponder equivalents (TPEs) in three dimensions over a 10-year timeframe; geographically, by application, and by frequency band, with granularity as shown in Figure 1.
Top trends driving the forecast include:
– Deployment of capacity expanding technologies, such as new frequency spectrum, frequency reuse, spot beam technology, and dynamic power allocation, will allow satellite service providers to create specialized product offers tailored to specific market segments. While many operators and customers associate higher throughputs with deployment of Ka-band capacity, the underlying technologies may also be deployed in a C- or Ku-band environment.
– Growth of consumer-oriented services, such as Direct-to-Home (DTH) video and mobility-based broadband technologies. In part, this is fueled by expanded willingness to pay for anytime, anywhere connectivity on the part of the consumer market.
– Growth in global mobility applications; the lion’s share of this market is maritime, but there is a new generation of aviation services that appears to be gaining market acceptance.
– Military demand for commercial satellite communications (COMSATCOM) has slowed relative to peak spending levels, but is still growing, albeit with more churn and smaller contracts. To the extent that the slowdown in demand reflects a gap between demand and procurement, pent up demand may be growing to drive cyclical growth on the other side of the turning point.
– The ongoing shift in purchasing behavior from (commoditized) wholesale transponder capacity to end-to-end solutions and managed services moves the industry up the value chain, increasing providers’ share of the wallet and creating provider stickiness.
– Technology innovation, such as electronic propulsion and dynamic power allocation (and possibly lower cost launches), will have broad implications for satellite design and construction, which, in turn, can change the cost structure of new capacity deployment.
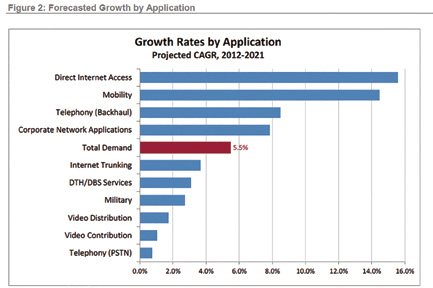
Futron’s 2013 forecast anticipates nearly six percent annual growth worldwide through 2021. Much of this growth is driven by demand for Ka-band service (approximately 22 percent Compounded Annual Growth Rate [CAGR]), with more moderate (approximately 2.5 percent CAGR) growth for C- and Ku-band service.
Among the specific applications in the forecast, greatest (double digit) growth is expected for Direct Internet Access (DIA) and Mobility. DIA primarily comprises consumer broadband, but is increasingly used for small businesses/home offices and some limited backhaul. Growth for DIA will be driven by high throughput satellite (HTS) availability and is expected to be greatest for Ka-band. Demand is expected to grow most quickly in traditionally undersupplied areas, such as East Asia and Southeast Asia. The greatest share of mobility demand is for maritime Ku-band services, with significant concentrations in Asia and South America.
Network services, particularly wireless backhaul and corporate networks are also growth drivers, though perhaps not as aggressively. Both of these service areas are poised to take advantage of high-throughput Ka-band deployments (possibly high throughput Ku-band as well), although this demand will be incremental to still healthy demand growth for C- and Ku-band services.
Two exclusions from the forecast should be noted: 3G and 4G wireless backhaul has still not been proven in practice to be economically feasible (despite several theoretical examples), and incremental demand stimulated by O3b’s launch of high-throughput medium-Earth orbit (MEO) service has been included. As time allows these models to be proved out, these could be sources of incremental growth beyond the current forecast. Nevertheless, demand growth for both of these services seems greatest for Ka-band (including some cannibalization of current Ku-band demand) and still in traditionally underserved areas, including South America, Eastern Europe, Middle East and Africa, and South Asia.
Figure 2 shows all forecasted applications in declining order of their anticipated compound annual growth rate (CAGR) between 2012 and 2021.
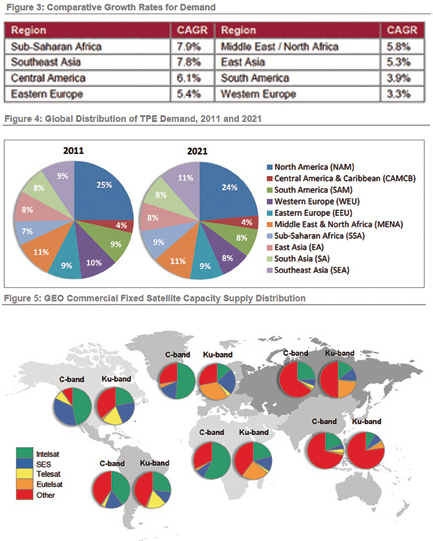
Similarly, Futron forecasts by geographic region. One recurring theme that can be seen in geographic growth is that regions with smaller starting demand grow roughly 50 percent faster than their higher demand counterparts, yet regional share of total global demand is fairly stable. Specific examples of the smaller markets/faster growth forecast are shown in Figure 3, while changes to the geographic distribution of demand over time are shown in Figure 4, both located on the following page.
Supply
At the global level, the total amount of fixed satellite service (FSS) supply in the C-band, Ku-band, and Ka-band is forecast to show strong growth by 2016. Despite widespread interest in new Ka-band services, much of the increase is related to strong growth of Ku-band capacity, which is the largest element of the current supply. Significant Ka-band deployments will dramatically increase the base of Ka-band capacity.
However, Ku-band continues to be the principal commercial band in terms of installed base and new capacity forecast to come online, accounting for approximately 52 percent of the TPEs added globally. The surge in overall supply—a 27 percent aggregate increase in supply during a five-year time span—is largely driven by increases in Ku-band TPEs, the unrivaled workhorse of the satellite industry. C-band is a mature and well-understood market segment is expected to experience small to flat growth during this timeframe. (Note that O3b, which is not a geostationary satellite service, is not included in our supply analysis.)
In addition to healthy overall increases in supply, there are several technology and industry trends that could alter the balance (and analysis of) supply over the longer term. Increased use of spot-beam technology is among these; as the market migrates towards spot-beam technology, both in the Ku- and K-band’s, supply (vis-à-vis demand) factors will become even more localized.
So while in aggregate the industry appears to have matured to the degree that global supply generally tracks well with global demand, Futron forecasts several pockets where supply and demand are mismatched. Importantly, the relative sizes of these mismatches will decrease as the industry moves to more spot-beam coverage.
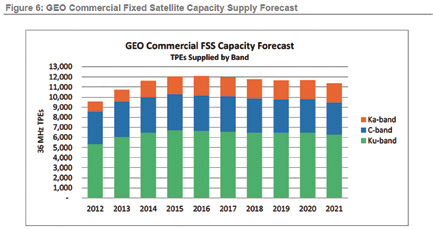
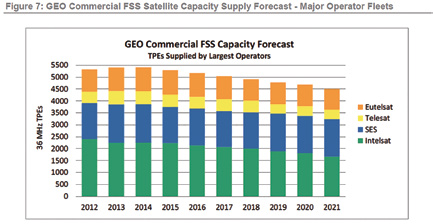
Thus supply may be carefully managed by the industry to meet the anticipated needs of local market conditions. Fleet optimization, via asset repurposing within a single fleet or acquisition/disposal between operators, suits the efficiency objectives of operators, and also serves to keep global supply in check at any given point in time. Other factors affecting supply include spectrum allocation, the availability of multiband equipment, and innovative supplier and customer partnering arrangements. Figure 5 shows the concentration of supply by region and by band, among the “big four” providers. It is interesting to note the significance of “other” players in providing Ku- service to East Asia and South Asia.
Looking forward, Figures 6 and 7 reveal how strong growth in all bands, including Ka-, which is excluded from the capacity snapshot in Figure 2. Figure 7 also shows decreased market concentration, as the collective market share of the top four operators falls from nearly 50 percent to approximately 40 percent.
Global
Although specific opportunities and utilization depend on supply and demand conditions in specific geographies, looking at supply and demand from a global perspective is instructive in gleaning the impact of specific trends.
One complicating factor in considering transponder demand is the impact of different capacity transponder types. To address this complication, particularly for a forecast period in which HTS are expected to emerge, Futron presents its global demand forecast in terms of throughput in Figure 8.
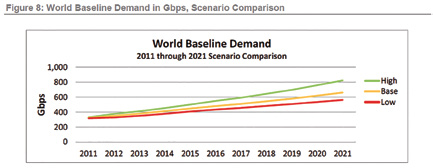
As was the case with the 2010 forecast, the current optimistic scenario shows more upside opportunity than the pessimistic scenario shows downside risk. The greatest drivers for the optimistic scenario are video services, especially distribution and DTH, cell backhaul, and Ka-band DIA.
For video, the differences between scenarios are based on changes in compression schemes, rate of phase-out of standard definition (SD) channels and periods of dual high definition (HD)-SD illumination, and availability of terrestrial alternatives.
For backhaul, scenario differences are based on ultimate demand for wireless services (based on general economic conditions) and the rate of migration to higher-bandwidth intensive technologies (e.g., 3G, 4G), whereas for DIA, the main driver of demand growth will be the pace of service availability.
In particular, the pace of Ka-band consumer-targeted supply growth will determine who has first mover advantage in providing service to traditionally underserved regions. Consumer broadband services via satellite should expect competition from terrestrial alternatives, but where there is currently a race-to-market; those broadband services are expected to formulate “sticky” products that will allow for customer retention, even as new options become available.
Comparison of supply and demand forecasts has allowed Futron to develop a point of view regarding price trends. While different regions and applications may have variations from the mean, overall our expectation is that pricing for C- and Ku-band pricing will remain fairly stable. Pricing for Ka-band capacity, particularly new capacity first coming online during the 2013–2016 time period, may show greater volatility in pricing.
One significant factor for new Ka-band services is promotional pricing to entice customers to accept the long lead times and execution risk associated with pre-launch purchase commitments. Customer expectations for cost reduction via migration to Ka-band may be elusive, as customers reframe price comparison from cost per infrastructure unit (e.g., TPE or MHz) to cost per throughput unit (e.g., Gbps).
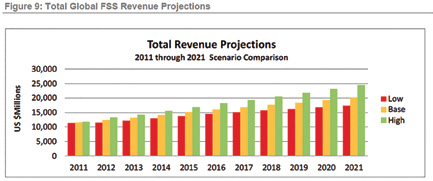
Figure 9 shows Futron’s forecast for total revenue associated with the demand forecast. Futron expects the global FSS market size to be approximately US$20 billion in 2021, with an optimistic scenario approaching US$25 billion.
At a global level, regional distribution of demand moves relatively slowly. North America will retain its role as a major buyer of satellite capacity for the foreseeable future, even with a shrinking overall global share of the market. The regions becoming more prominent on the world stage this decade are those whose infrastructure is racing to keep up with demand, specifically Sub-Saharan Africa and Southeast Asia. Demand growth in these markets is fueled by consumer broadband (DIA), Mobility, and Corporate Networks applications.
Another factor driving regional differentiations in growth is government intervention, as exemplified by the case of India. This forecast reflects a great deal of regulatory and national policy uncertainty for India, whose market potential is strong, assuming a favorable regulatory environment. In other markets, the key government/regulatory issues focus on spectrum allocation, which could affect traditionally underserved markets, like Sub-Saharan Africa. Figure 7 shows the anticipated global distribution of demand globally for 2012 and 2021.
Overall, the FSS market continues to be strong and is expected to show sustained growth as technology empowers greater levels of customer service delivery along a spectrum of price points. Despite threats that U.S. Government’s challenging procurement environment over the next two to three years may suppress overall demand during that period, the long-term outlook remains strong.
The 2013 Futron Forecast of Global Satellite Services Demand provides forecasts by application, by region, and by frequency band (including C-, Ka-, Ku-, and X-band) measured in both transponders and throughput. Additional features include a five year supply transponder supply forecast, as well as commentary on technology developments, key market drivers and potential growth inhibitors, and pricing trends. Detailed data charts in the Appendix offer sufficient granularity to enable user-defined further analysis.
About the author
Sima Fishman currently leads Futron’s Corporate Strategy Practice, advising corporate, government, and financial clients on business issues of relevance to the satellite, telecommunications, government contracting, and space industries. She has extensive experience serving clients in the U.S., as well as Africa, Asia, and Latin America. Ms. Fishman typically leads engagements involving financial and economic analysis and she specializes in cutting through complexity to facilitate actionable decision making. Recent client work has included expert witness testimony, financial due diligence, regulatory assessment, economic impact analysis, and market forecasting. Email: sfishman@futron.com
For information regarding Futron’s Forecast Of Supply & Demand
http://www.futron.com/2013_Futron_Forecast.xml