
AARSE, the African Association of Remote Sensing of the Environment, in cooperation with EARSC, has published an inventory of the African private Earth Observation (EO) and Geospatial industry.

Central Algeria captured by Copernicus, Copernicus Sentinel data (2015)/ESA Text, charts and layout: AARSE & EARSC.
General inventories of organizations involved in remote sensing applications are available for some countries in sub-Saharan Africa. A survey targeting the African private sector involved in EO and geospatial sciences specifically, however, has never before been completed.
This study is the first of its kind for this continent and a start in understanding how companies in Africa operate, capture their expertise and assess their state and health.
AARSE and EARSC analyzed the data of the survey, which was collected and compiled between February and April 2016.
Note: All of the text, charts and layouts within this article are courtesy of AARSE and EARSC.

The survey covers the private EO services industry across Africa, which has been defined as any company selling products or services which contain some data coming from EO satellites. The EO industry comprises satellite operators, data suppliers, value-adding companies or Geo-Information (GI) companies using derived products where the satellite data are not always visible.
A total of 229 companies were contacted, with useful responses coming from 78 of them via an online questionnaire. These respondent companies represent 21 out of 54 countries in Africa. The bilingual questionnaire (English and French) was focused on basic company information, numerical data and estimates as well as some issues of strategic relevance. The number of questions was kept to a reasonable range to avoid saturating responders.
The results show an industry in development. There has been growth in revenues in the past few years, accompanied by a good growth of employment in the sector, resulting in an optimistic outlook, albeit cautious, of the near future.
The sector has seen a lot of change in recent years, e. g., the launch of a number of new commercial satellite systems as well as significant technology change with the development of Google Earth and the advent of cloud computing. These and other technologies, such as Remotely Piloted Aircraft (RPA) systems, are arriving on the horizon and perhaps other technologies will emerge in the not too distant future.
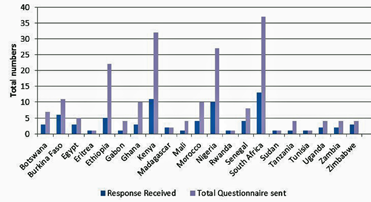
Number of companies contacted—number of companies that responded.
The launch of the first European Copernicus Sentinel satellites have heralded the arrival of vast amounts of new data with full, free and open access.
Also in the political arena, major developments have also occurred, such as the adoption of the African Space Policy and Strategy, and the Global Monitoring for Environment & Security and Africa initiative, GMES & Africa in short, that promises to deliver new services for African policy makers and may offer new opportunities for the African EO industry.
Industry facts and figures will be revisited in 2018 to assess the impact these factors may have had on the African EO services industry and to map the growth and trends that are shaping it. In the meantime, the results for 2016 follow.
The views in this document are those of AARSE and EARSC and are not necessarily approved or endorsed by the European Commission (EC).
Strategic Context
The years from 2000 to the present are crucial for the development of EO in Africa. Advancements in Information Systems/Information Technology (IS/IT) have made it possible to access information that was once unthinkable to acquire. A huge amount of geographical data was made available, attributable to the growing of a number of related public and private institutions in many parts of the continent.
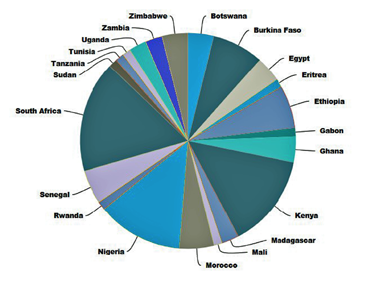
Geographical distribution of respondent companies.
Several technological innovations have contributed to this:
• The increase in spectral and spatial resolution of data delivered by newly developed Earth orbiting sensors in Europe, the US and other countries provides more cost-effective access to framework data and mapping bases.
• Increased affordability of personal computers and microelectronic equipment as well as tele- communication services giving access to the Internet at least in some parts of Africa, have paved and are paving the way for an avalanche of information in Africa—for scientific research, for broader society, and for planning and policy purposes.
• Google Earth
• A number of EO and geospatial-specific programs coming from the US, Europe, Japan and other major EO players have stimulated needs for proactive capacity development in EO and geospatial technologies in Africa.
• In the last 10 years, four African countries (Algeria, Egypt, Nigeria and South Africa) have built smallsats, moving the continent out of the class of being ‘sensed’ to ‘sensing.’ At the same time, a continent-wide, EO infrastructure has been developed. Across Africa there are now more than 20 national space agencies (also referred to as national remote sensing agencies), as well as regional centers and over 45 universities dedicated to building expertise in EO technologies.
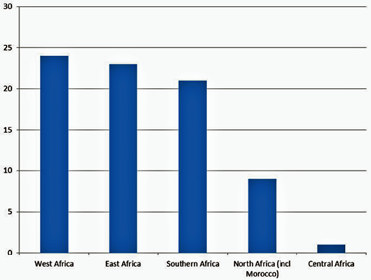
Number of companies per African sub-region.
With technological advancement on the continent being steady, a growing EO market, an increasing EO user community, a breed of enterprising remote sensing experts and a dynamic science network (that AARSE has helped to foster) can be seen.
It was believed that these developments have created space and impetus for the growth of the African private EO sector. In this context, AARSE, at its Executive Council meeting in October 2014, had decided to conduct an Africa-wide systematic survey of private sector companies engaged in EO and geospatial information sciences, in order to...
• Compile an inventory of existing African companies
• Gather knowledge on employment creation and markets
• Gain more knowledge of the sector in the light of new programs and initiatives
• Facilitate associated representation of the private sector
This tied in well with the activities concurrently undertaken by EARSC to expand the international scope of its EO industry survey to Africa.
In the policy context of the EU-Africa cooperation in space science and technology, and the European EO Program Copernicus, the implementation of the GMES and Africa initiative calls for the application of approaches developed in Copernicus, notably by adopting a free and open data policy, by focusing on operational services and by involving the private sector in the services development.
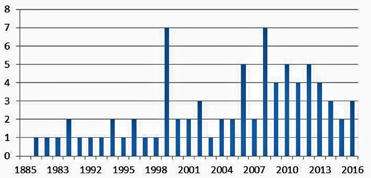
Number of companies formed per year.
AARSE and EARSC have closely cooperated in conducting this survey and presenting its results and will strive to facilitate connectivity by identifying potential areas of cooperation between African and European EO companies, creating the required synergy.
Industrial Landscape
The survey questionnaire was sent to 229 companies, representing 28 out of 54 countries in Africa—78 responses, were received, representing 21 countries.
The pie chart above shows the countries from which company responses were received.
Approximately 50 percent of the responses were derived from four countries, namely South Africa, Kenya, Nigeria and Ethiopia. The study team assumed the following reasons could have played a role for the establishment of private companies in these countries:
• Thriving of private sector is encouraged at government level
• A rapidly increasing EO user community, and a new breed of remote sensing experts trained locally and abroad, who see opportunities for going private
• Local presence of several UN-bodies, international service providing organizations such as ESRI, EO related international companies (e.g., in photogrammetry, remote sensing, image processing, etc.) including foreign based hardware and software firms partnering or using the services of local expertise to expand in the African market
• Capacity building centers and facilities of which private companies can make use
When grouped according to regions, it can be seen that West Africa is most strongly represented, followed by East and Southern Africa.

Development of private sector companies.
Looking at the formation of new companies over the last 25 years and their development, the study team noted that the African private sector has continuously grown. The fall away in the last two to three years may most likely be attributed to new companies not yet becoming visible and this should not be considered as evidence for any slowed growth.
Particularly, up from the early 1990s, the private industry has been picking up—incorporation of new companies has been the strongest over the last 15 years.
More than 90 percent of companies are privately owned, which support the view, coupled with the large proportion of small and microenterprises, that these are start-ups in a sector that is relatively new and immature.
The survey was extended to a number of companies that are assumed to be larger companies with subsidiaries in an African country. However, only one of those firms responded to the questionnaire.
Ninety-six of the responding companies (75 out of 78) confirmed that they work with EO / satellite data or products derived from that data. The survey definition included acquisition of remote sensing data, maintenance and archiving, dissemination and distribution, analysis and interpretation, integration of interpreted data with other spatial data and models, as well as training in all of these aspects.
The study team believes the picture presented to the left is representative for the current African EO services industry. In the absence of responses, there were no means present to establish whether these companies exist, have been renamed or have perhaps merged with other companies in the same country, meaning no secured data was available.
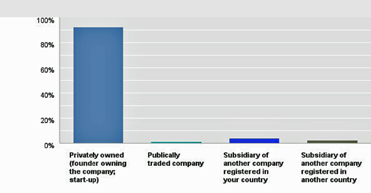
Company ownership.
The questionnaire had asked respondent companies to provide contact details of other companies that would qualify for the survey. Only a few respondents headed that call—for whatever the reason—the overall impression, therefore, was that this sector is rather fragmented.
Despite several channels used to publish the survey and stimulate participation, responses from companies in several countries were particularly hard to obtain—Namibia and Mozambique in Southern Africa, Ivory Coast and Guinea in West Africa as well as Egypt and the Maghreb. Concerning the latter, no response was received from companies in Algeria, a country known to be a major player in space technology in Africa.
For several countries, company contacts were unattainable—Angola, Democratic Republic of Congo, Liberia and Sierra Leone, as examples. The assumption is, however, that there are local EO/ Geospatial services companies engaged in business with large multi-national players in the extractive industries in these countries.
The study team does know from personal experience that African geologists and geophysicists are supplying expert services to international players in the mining sector (e.g., China, Japan, Russia and Australia). However, no reliable quantitative data can be currently presented.
Last, but not least, several countries from which no responses could be obtained currently suffer from political crises and conflict situations that are far from conducive for any high-tech private business.
Employment
Taking out the anomalous 750 staff employed by one publicly traded company in the data sample (but accomplishing rather little EO business), one arrives at an overall number of 1,417 people employed in the sector. That represents an average of 18 employees per company. The study team considered this as representative and realistic.
Broken down per country, the table is derived and shown at the top of the following page.
Companies in six countries, namely Morocco, Kenya, South Africa, Nigeria, Madagascar and Botswana, employ more than 100 persons, amounting to a total of 961 employees (~68 percent of 1,417 total employees). The responses received from the two companies in Madagascar suggest, however, that these are private enterprises within a public institution.
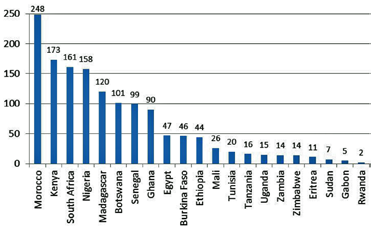
Employment per country.
The study team had no means to ascertain whether the numbers accounted for in this case are private or public employees. Looking at the regional breakdown for employment and the breakdown to EO related employees the following details become evident.
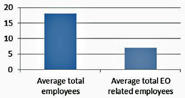
More than a third of people employed by responding companies are engaged in EO related activities as defined above, namely 552 out of the total of 1,417 employees. The average number per company is seven people engaged in EO related activities, while the average of total employment per company is 18 people.
To get a feel for the continuity of business, companies were asked to indicate whether the number of EO related employees changed much ‘in the last few years.’ As shown in the chart below, 34 percent of respondents indicate that the number of their EO related employees stayed the same, 33 percent indicated that number had increased somewhat and 20 percent reported that their numbers had significantly increased.
This seems to signal, quite reassuringly, that companies have stayed in business for a number of recent years; a third have been able to employ more people during that time period, and a fifth of companies even managed to expand their EO related activities by significantly increasing their staff.
When asked to give a forecast on the number of their EO related employees over the next 12 months (2016), the majority of all respondent companies expressed cautious optimism: around 53 percent of the respondents expect a slight increase in the number of EO related employees; 15 percent of companies were very optimistic about being able to significantly increase staff. A quarter of respondents (24 percent) believe staff numbers will stay the same. Only five respondents out of 70 fear they might have to reduce staff in the coming months.
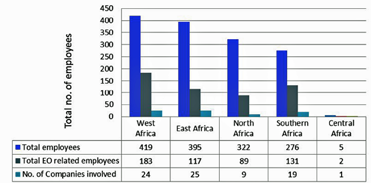
Table of the total number of employees, total EO related employees and the number of surveyed companies per region.
Overall, these results suggest the sector has grown and is likely to continue such growth in the near future.
Revenues
To get a feel for financial performance of the sector, the study team had cautiously asked companies about their revenues. As disclosing revenue figures is a sensitive issue, companies were asked to only summarily indicate the range of their last year’s revenue (i.e., 201 5 figures) from EO related services, how revenues developed in recent years and what trend they would expect in the near future (2016).
As shown in the Revenue Bands chart, 56 percent of all companies (70 answers) had performed in a band of up to $100k in 2015; 26 percent of respondent companies indicated a revenue band between $100 to $ 500k; 11 percent revealed a band from $500k to $1 million. Only around 7 percent of companies had revenues in the band of $1 million to $5 million or above. These revenue figures confirmed the earlier observation that the majority of companies are rather small firms.
To obtain an overview of where the largest players in the sector are located, a regional break down is provided in the Regional Revenue Bands chart.
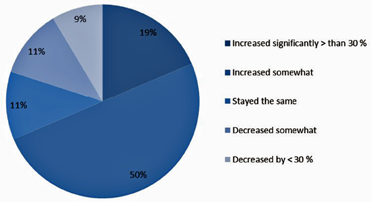
Responding on changes they had experienced in their revenues in the “last few years,” 55 percent of companies claim that their revenues increased somewhat, 18.57 percent claim revenues increased by more than 30 percent and 11 percent stated revenues stayed the same or somewhat decreased. Approximately 8 percent of respondents stated that their revenues had fallen by more than 30 percent.
As with employment evolution, the study team also noted from revenue developments that the industry has steadily grown, with some companies having done quite well in increasing their earnings in the last few years.
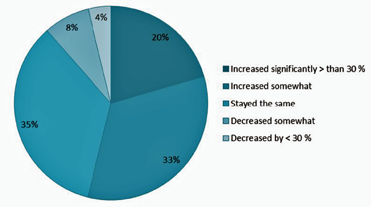
Employment change.
Given that most surveyed companies are micro-sized or small enterprises, the fact that revenues accrue primarily in companies’ home countries (countries where they are legally registered) should not be surprising.
Seventy-five percent of responding companies operate primarily on a national level. Some 15 percent of companies also realize income beyond national borders, i.e., in their sub-regional neighborhood. The number of companies that have business on a continental scale, or receive international revenues, is relatively small at around 10 percent.
When queried about expectations of EO related revenues over the next 12 months (2016), the vast majority of respondents turned out to be rather optimistic—if not enthusiastic—about being able to increase their revenues. Forty-five of the 69 respondents expected a significant increase in their revenues and 42 percent a slight increase. Only some 7 percent (five responses) expect their revenues to stagnate, with around 5 percent of the respondents (four responses) fear their revenues will slightly or significantly fall over the next 12 months.
By and large, companies seem to be trusting in continued growth, both in revenues and employment.
Activities
One principal purpose of the survey was, of course, to find out what companies actually do, who their customers are and in what segments of the market they operate.
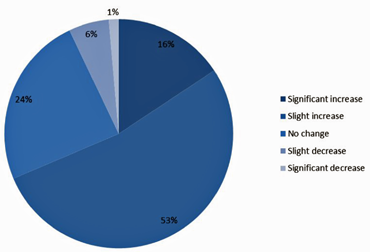
Employment expectations over next 12 months (2016)
Companies were asked to indicate where the focus of their EO related business is—results revealed that EO service companies in Africa are active across the entire value chain (illustrated) and the chart below shows the relative size of each part of that value chain.
As shown, the service type of companies’ EO related business is clearly in downstream/GIS services (84 percent of 70 responses).
Seventy-five percent of responding companies also engage in consultancy—that reflects studies and analyses which are not value-added services and other support activities; and 64 percent of responding companies provide value-added services using satellite data to create products.
Thirty-seven percent of companies resell satellite or other data from third party sources and 24 percent do business in hard products or software. Only 10 percent of responding companies worked with command space infrastructure or as satellite operators. Not entirely clear at this stage is what kind of space infrastructure and/or satellite operations are referred to by these respondents.
Five percent of companies (four responses) receive and distribute data, meaning they are owners or operators of a ground station.
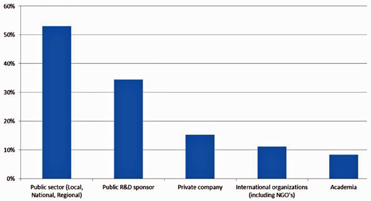
Customers
Tying in with other observations from the survey that companies primarily operate locally and their services are driven by local information needs, it clearly emerges that the public sector is the principal customer for respondent companies (53 out of 70 responses). But private companies are also important clients (34 out of 70 responses). However, it is assumed that these private clients would probably be mining companies, agricultural consortia, forest plantations or construction companies (roads, etc.).
Only some 15 percent of respondents have clients in international organizations and non-governmental organizations (NGOs). As could be expected, public R&D sponsors and academic institutions only play a minor role for the business of private companies.
More than 88 percent of respondents confirm to regularly providing training. Only about 11 percent (8 companies out of 70 responding) do no training whatsoever. Out of the 62 companies that carry out regular training activities, 58 percent of companies do so for the company employees as well as potential customers, while 25 percent of companies target potential clients only and 16 percent only for company employees.
The type of training that companies engage in is shown. Eighty-five percent of companies provide GIS training. This is not surprising, given that the main business activity of surveyed companies is in downstream services.
However, 62 percent of respondents also do training in remote sensing, 57 percent in data integration as well as in image processing and 53 percent in application oriented interpretation. Training in modeling is accomplished by 34 percent of respondents.
Twenty-one percent of training actions by respondent companies concern other subjects. Among these are photogrammetry, UAV training, geospatial web-application development, geo-software development, applications and interoperability training, spatial databases, GPS, hydrography, data acquisition, numerical cartography, hydrography and disaster risk management, as indicated by the comments from respondents.
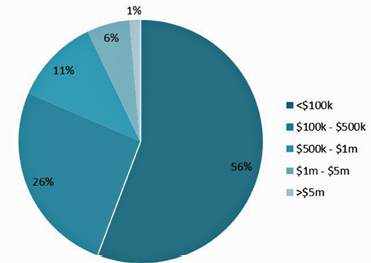
Revenue bands in 2015.
To find out something about the network companies would command, companies were asked about their working relationship with other companies—in Africa and elsewhere.
It turned out that—if they work with other companies—companies collaborate foremost with other companies in African countries (other than the country of the company’s location). Seventy-six percent of respondents indicate to have working relations with companies in other African countries, while 64 percent of respondent companies seem to have working relations with European companies and 47 percent with companies in North America (US, Canada).
A quarter of all respondent companies had working relationships with Asian companies. Not surprisingly, working relations with companies in Australia and Latin America are mentioned by only a few companies in the survey sample.
Thematic Areas
Companies were asked to indicate in which major market segments they do business. Responses from surveyed companies suggest that business is primarily done in the three following segments of the market:
• Local and regional planning (66 percent of respondents)
• Environmental, pollution, climate (59 percent)
• Agriculture (51.43 percent)
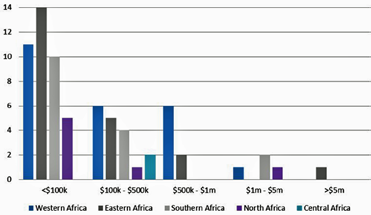
Regional revenue bands from EO related business in 2015.
Other important segments comprise the utilities sector (water, electricity, waste), indicated by 37 percent of companies, the mining sector (21 percent), and transportation (15 percent).
Ten percent of companies do business in Forestry, and in the area of Humanitarian operations / Health, respectively. Eight percent of companies engage in business in the Oil/ Gas arena, while 7 percent of respondents are active in the security sector. Few companies (four responses) in the sample do business in more special areas, such as Maritime monitoring or Fisheries. Six respondents (eight percent) choose “other” but did not elaborate.
The large picture of market shares on the previous page ties in with findings on the clients of responding companies. They mainly service information needs for planning purposes and utilities provision as well as for environmental monitoring and agricultural development.
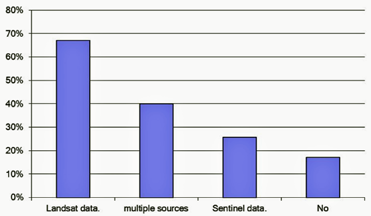
EO Data
Given that this survey was conducted in the context of the European EO Program Copernicus and the policy on free and open Sentinel data, obtaining information on which of the free satellite data sources companies currently use, what data they purchase and how much money they have to spend on the acquisition of commercial data.
As shown, not surprisingly, 67 percent of all respondents (70 companies) currently use free Landsat data. Twenty-five percent of respondents currently use Sentinels’ data, while 40 percent are using free data from multiple sources.
Revenue change.
Comments on data from multiple sources indicate, that in addition to Google, companies use SPOT, SPOT VGT, ASTER, ASTER DM, MODIS, SRTM and NOAA—17 percent of respondents are not currently using any free data.
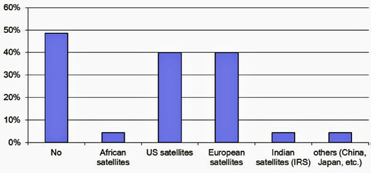
Asked whether they currently buy data from commercial suppliers and from where, companies responded as follows:
Forty-eight percent of respondents do not currently buy data from commercial suppliers at all. Forty percent do buy data, namely from US as well as from European satellites. Some 4 percent (three responses) buy data either from Indian satellites (IRS) or other operators. Three respondents buy data from African satellite operators (see graph below).
The latter suggests that African satellite data do not currently play any significant role for private business. As it turned out in answers to an additional specific question on African satellites, namely the NIGERIASAT family, ALSAT family, EGYPTSAT family and SumbandilaSat, results revealed the vast majority of company respondents do know of these data suppliers (78 percent). However, 21 percent of respondents, (that is, 15 out of 70 respondent companies) are not aware that some African nations have their own smallsats.
Those respondents that buy data from commercial suppliers were asked to provide rough figures for the average annual amount they spend on satellite data. The respective sample here was obtained from 38 companies.
Thirty-four percent of these companies spend $20k on satellite data, on average, per year. Thirty-four percent of respondents spend $10k or less per year. Fifteen percent (six responses) stated they spend $50k and the same number of respondents said they spend $100k or more per year.
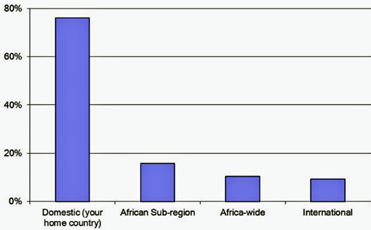
Geographic origin of revenues.
As will be seen in the following, cost of EO data is perceived to be one of the most significant barriers to growth of the industry by many respondents.
Costs of data needed to be reviewed, as they were prohibitive for the average user. Availability and accessibility of free data was regarded as the one factor that could strengthen business in the sector.
Looking at the data used by companies and the segments in which they do business, the conclusion is that they are talking of high resolution datasets. In addition, data quality and standards for each end use application was also mentioned as a critical issue.
Strategic Issues
To understand how the African private EO industry is currently doing, respondents’ views on obstacles to growth and on challenges faced, were solicited. A majority of respondents (70 answers) perceive the following three issues to be the most significant barriers to growth:
• Customers recognize benefits but lack budget (by 80 percent)
• Lack of development funding (by 65 percent)
• Cost of EO data (by 58 percent)
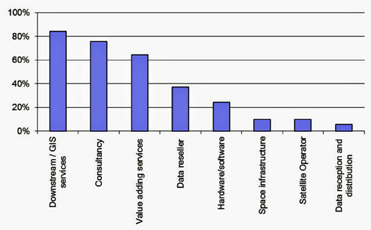
Spread of EO related business.
Contract compliance and contract acquisition are also severe problems noted by 50 and 44 percent of respondents respectively. Thirty-four percent do not see that there is enough market and user acceptance. Thirty-two percent see a problem in the lack of operational data supply.
Comments given on the latter issue concern cost of high resolution data impacting on both existing and new customers; some EO data being too costly for small developmental projects; existence of companies monopolizing access to EO data; data piracy and insufficient data standards.
In terms of governmental and private sector support, the most severe factors hampering growth are seen in:
• Unfavorable policy and legal provisions (by 37 percent)
• Lack of development funding (by 65 percent)
• Lack of venture capital (by 65 percent)
The percentage citing unfavorable policy and legal provisions is even greater in the French speaking sample of respondents (47 percent). It might be assumed that public institutions in Francophone Africa exert a heavier grip on the EO related industry than in the somewhat more liberal sub- regions of Southern and Eastern Africa as well as in Nigeria.
This might tie in with the facts that a) the study team was able to identify a comparatively higher number of companies in English speaking Southern and Eastern Africa as well as Nigeria than in West and North Africa, and that b) in general, companies from the former regions more readily responded to the survey questionnaire than those from the North and West of Africa.
Overall, companies’ valuation of problems depending on policy and legal provisions is clearly addressed to national African governments, sub-regional African governing authorities and to the AUC (such as completing their commitments for the implementation of the African Space Policy and Strategy, involving the African private EO and geospatial sector, GMES & Africa, etc.).
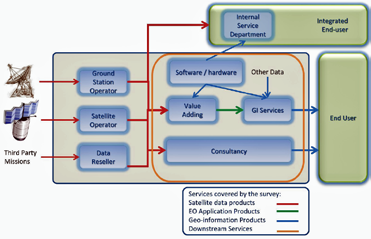
Services covered by the AARSE/EARSC survey.
Not specified was what development funding would exactly mean from the perspective of respondent companies, the supposition being that such would be comprise of both African R&D programs as well as ODA funding by international entities, including greater support from EC programs.
Companies cite the lack of a stable revenue stream as being a particular issue. The project-based nature of the business today is certainly a key factor. This may change in the future as a swing away from bespoke products (project-based contracts) to off-the-shelf products (service-based contracts) continues to develop.
Lack of venture capital seems to be a common complaint, both in Europe and in Africa. A stable business environment with potential for growth is a pre-requisite and this is questionable for different reasons on both continents.
One of the main reasons is probably the highly technical nature of the business where traditional investors are not comfortable to provide capital. This is not the case in the US, where evidence can be seen of technical savvy investors backing new often blue-skies ventures. However, this class of investor seems to be missing in Europe and Africa and further effort will be needed by companies and governments alike to help free up investment capital.
One key step is for governments to acknowledge their role as purchasers of services and in doing so to provide an underpinning market and revenue source for companies. This is a key step which is complicated by the presence of many government research bodies which provide services to their governments. After all, in Africa, some 63 percent of revenues come from governments, a similar figure to that observed in Europe. Governments are customers for EO products as well as seeking to sponsor the sector as a perceived high-tech growth area.
Competition coming from other EO suppliers is considered a threat to their own company’s growth by 27 percent of respondents. In comments on this issue, competition from government funded National Space Agencies was pointed out, as well as competition from European companies, particularly in connection with European-funded projects, in which companies from Europe were given preference over those from Africa.
Percentage of business per customer category.
Ten percent also considered competition from non-EO sources. Here, losing business to surveying and mapping companies was mentioned as an example.
Lack of staff (14 percent) seems to be regarded as a minor issue, suggesting that trained professional staff can be found on the market. However, several respondents did remark on a lack of staff with special skill s, sufficiently educated professionals and limited capacity in business management.
On the assumption that there might be a need for the African private sector to get better organized and have the continent’s needs and interests better voiced and heard, companies were asked about their opinion on a trade association.
A majority of respondents (69 answers) expressed interest in a trade association at national (58 percent) and / or continental levels (60 percent). Interest for an association at sub-regional level is a little less (52 percent), and some 7 percent of respondents are not interested at all in such an endeavor.
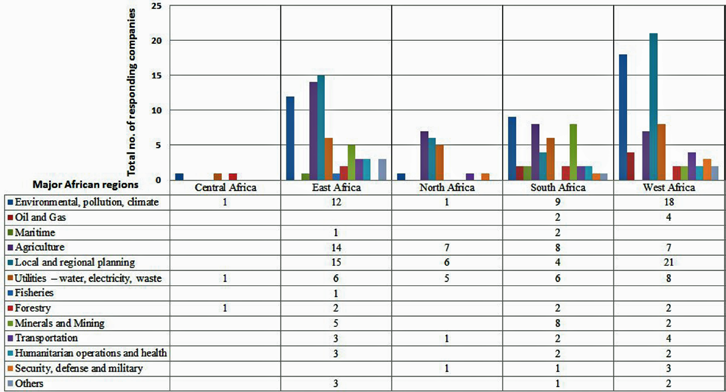
Major market segments where responding companies do business. The horizontal axis (x) reflects the five regions of Africa, while the vertical axis corresponds to the total number of responding companies.
Ninety-five percent of all respondents expressed their interest in engaging more closely with AARSE, currently the only Pan-African organization representing the EO and geospatial research and services communities in Africa, as well as in closer collaboration with European counterparts as represented by EARSC.
Responses on the question, what further steps companies would like to see AARSE and EARSC take for strengthening the EO industry in Africa and facilitating collaboration, are revealed in the chart below.
Eighty-four percent of respondents suggested joint projects. Training in topics such as project planning, processing of data, etc., and more opportunities for information exchange (such as conferences, exhibitions, e.g., the biennial AARSE conference) would be also highly welcome (73 percent of respondents).
Almost the same number of respondents would go for partnerships (71 percent). Several respondents gave detailed suggestions of what would be useful, thereby giving AARSE and EARSC more dedicated actions to consider.
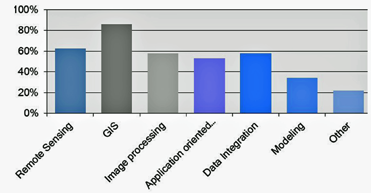
Training subjects.
Copernicus, GMES & Africa
Common research interests by the parties involved in the present survey commanded to find out whether African companies knew about Copernicus, the satellite data already provided and planned under the European Earth Observation program, and the Europe-Africa cooperation in EO, namely the GMES & Africa initiative. Survey findings revealed that:
• Fifty-one percent of respondent companies indicate to have never heard about Copernicus.
• Fifty-eight percent of all respondents (70 companies) are not aware that data from the European Sentinel satellites are free and open. Thirty-eight percent are aware and plan to use Sentinels’ data. Two respondents claim to be aware but have no plans to use these data
• Sixty-seven percent of all respondents indicated that they are not aware of GMES & Africa. Only a rough third of all respondents seems to know about this initiative of Europe-Africa cooperation in Earth observation. However, companies show great interest in the envisaged services of the initiative. Six thematic areas of GMES & Africa are considered relevant for their current business by more than 50 percent of respondents. This ties in with the market segments companies are primarily operating in. The spectrum of responses is given in the chart below.
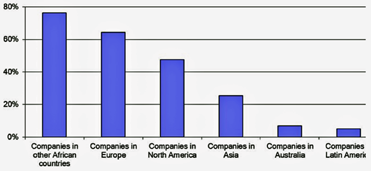
Business relationships with other companies.
The assumption is that companies might merely find many of the envisaged themes in the GMES & Africa initiative interesting and/or consider them important aspects in the development of Africa in general, and/or hope to expand their business activities into other fields, expecting to partake in the GMES & Africa initiative.
In summary, a clear message can be derived from the findings above, namely that Copernicus and the Sentinels program, as well as the GMES & Africa initiative, are not too well known across the African private sector.
Action seems to be needed to achieve greater awareness and better involvement for the private sector. As one of the global players in space, the European Commission would have to strengthen their outreach and dissemination efforts on Copernicus services and Sentinel data.
Use of free satellite data.
There seems to be a particular need for the African Union Commission to assume a coordinating role and to better inform the African private sector about major political developments on the continent, namely the African Space Policy & Strategy and major initiatives such as GMES & Africa.
Concerning global efforts by the Group on Earth Observations (GEO) and, more particularly, the African initiative of AfriGEOSS that aims at the enhancement of Africa’s capacity for producing, managing and using Earth observations, company answers offer a clear picture:
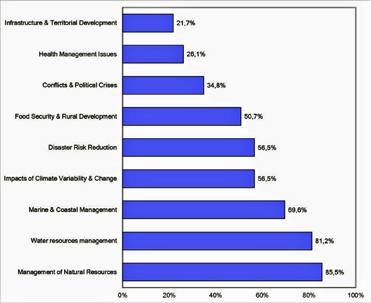
Obviously, companies consider themes highly relevant that somehow if they relate to the market segments many of them operate within—this concerns Infrastructure & Territorial Development, Management of Natural Resources, Food Security & Rural Development, Water resources management and Impacts of Climate Variability and Change.
Use of commercial satellite data.
However, themes that are not reflected in companies’ business in other responses are also considered relevant, such as Disaster Risk Reduction and Health Management. Seventy percent of responding companies are not aware of GEO or AfriGEOSS—not even one-third of respondents seem to have even heard about those endeavors.
Apparently, GEO/ AfriGEOSS is not understood by the African private sector. Companies might assume that AfriGEOSS is mostly about policy issues, even if they know about these initiatives. Thus, there seems to be a need for AfriGEOSS to step up activities to better inform the private sector about AfriGEOSS’ coordinating role and demonstrate what companies could gain from it. Likewise, private companies should also demand information and express their need for enabling policies.
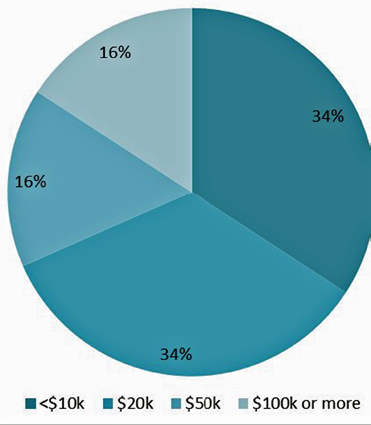
Annual expenditure on satellite data
The Future
In conclusion, this industry survey has provided a rich source of data on the EO services industry in Southern, West, East and North Africa, which has been used to generate the analysis and the charts in this article. The anticipation is that the dataset will serve to support further analysis against more specific questions which may be posed and to support industry facts and figures in the future.
AARSE and EARSC wish to use this survey as the start of a regular analysis of the African EO industry with a target to generate a report once every two years to determine how this market segment has changed. In order to be able to do that, the organizations count on the respondents to this survey and all of those many companies that did not, or could not, be identified. AARSE and EARSC will seek to broaden the database of companies, particularly in some African countries and regions which have not been fully engaged in this survey. All African companies that have not responded, or that we may have overlooked, to send their contact information to these organizations.
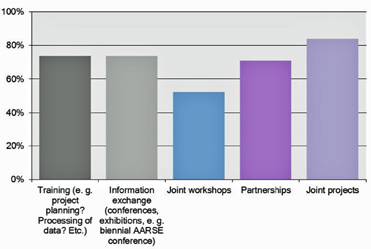
Company expectations from AARSE and EARSC.
Strong interest has been expressed by companies in collaborating with AARSE. AARSE will step up activities to better involve the private sector, provide relevant information and facilitate connectivity between the African private sector and international actors.
Though primarily operating on national level, many companies seem to see an opportunity in a Pan-African or sub-regional trade association. AARSE and EARSC will help facilitate this by sharing EARSC’s experience in coordinating the private EO sector in Europe.
Companies also expressed interest in stronger relationships with European companies. EARSC members are interested in developing links with potential partners in Africa, and subsequent actions to this survey, such as a trade association representing African companies, would help in this. Further steps should be identified to enable such links to be developed including measures connected to Copernicus and GEO.
Relevance of GMES & Africa services to companies’ current business.
This survey has covered the industrial EO services sector in several African countries but has missed some important elements that should be covered in future surveys.
First, the employment figures should be complemented with those of public sector bodies using EO data. The sector is a particular mix of public and private actors and the survey has deliberately only looked at the private side as a clear priority.
Second, coverage would need to be extended to the whole of Africa, particularly to some countries and regions that are not well represented this time round.
Third, concerning the private sector, the study has only looked at those companies which are supplying services to others. There are many organizations which are using EO data as the basis for analysis within their own organization i.e., as internal service departments.
africanremotesensing.org
www.earsc.org
www.earsc-portal.eu
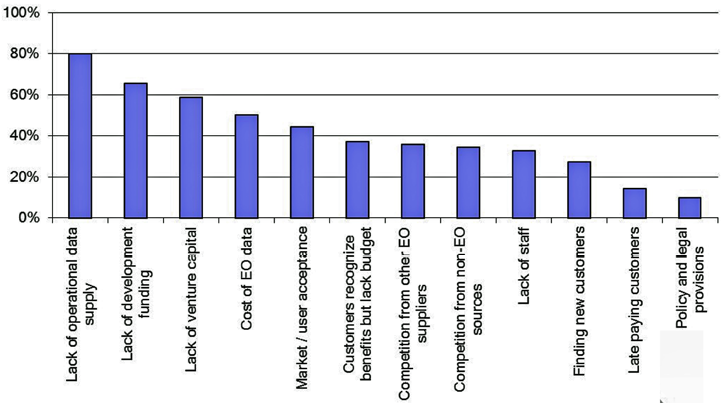
Negative impacts on industry growth.