
The project seeks to use satellite imagery and predictive analytics to assist the park’s rangers and better protect the dwindling elephant population.
Poachers are killing the elephants of Garamba National Park in the Democratic Republic of the Congo at an unprecedentedly rapid pace.
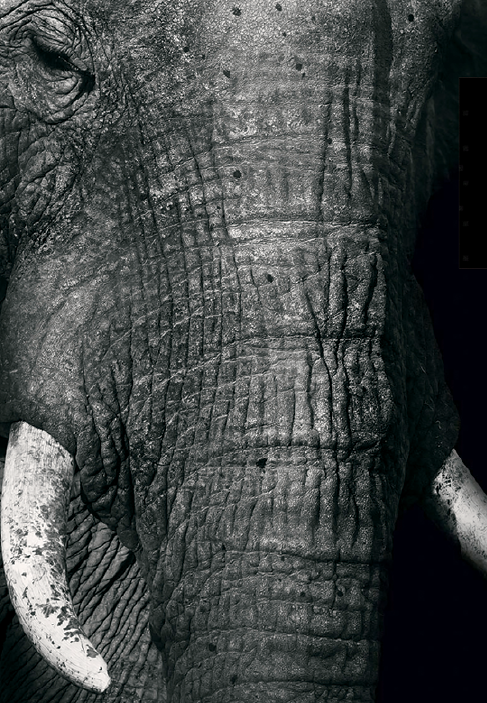
Since mid-April of 2014, park rangers have found the carcasses of 131 elephants1, slaughtered for their tusks. Unlike in the past, when criminal gangs carried out most of the poaching, the main actors appear to be heavily armed groups using professional techniques. Some of the poachers have been involved in Central Africa’s many conflicts and have carried out multiple atrocities against civilians, creating much misery and suffering over the past decade.
The Lord’s Resistance Army (LRA), renegade elements of the Congolese national army (the FARDC), and armed poachers from South Sudan and Sudan, have led this recent upsurge in poaching.2 These groups, in contrast to the criminal gangs, use their revenues from poaching in part to fund their continuing military activities through purchases or food, weapons, ammunition and other supplies.
This increase in poaching is both qualitatively and quantitatively different from previous experience at Garamba. In the past, poachers have relied on relatively low technology tools and have tended to kill one or two elephants at a time. According to African Parks, which manages Garamba on behalf of the Congolese government, the recent attacks have resulted in three to eight elephants being killed at a time, with the tusks often being removed by chainsaws. There is evidence of at least nine elephants being shot from helicopters.3
This information being presented in SatMagazine is a follow-up to a report produced in 2013 by the Enough Project, The Resolve, Invisible Children, and the Satellite Sentinel Project, with DigitalGlobe’s assistance, that described how the LRA poaches elephants in the Democratic Republic of the Congo’s Garamba National Park. The project seeks to use satellite imagery and predictive analytics to assist the park’s rangers to level the playing field with the poachers and better protect the dwindling elephant population.4
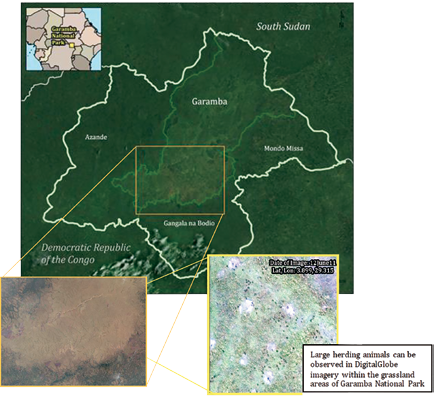
Figure 1.
Since the 1980s, the Garamba elephant population has fallen to about 2,400 from approximately 20,000, largely due to poaching. This effort to use the latest technology to better equip rangers to protect elephants is currently being tested in Garamba—if the partnership with the park’s rangers is successful, the technology can be replicated in other parks across Africa.
The slaughter of African elephants for their valuable ivory has reached the point that according to the World Conservation Society (WCS), 96 elephants are killed each day. WCS’s 96 Elephants coalition, of which the Enough Project is a member, estimates that poachers killed 35,000 elephants in 2012. The pace of poaching is putting pressure on a continental elephant population that has declined by more than 50 percent in the past 30 years.
Ivory prices have reached a record high because of high demand in east and southeast Asia, especially China. On the black market in Asia, elephant tusks are valued at $1,000 to $1,300 per pound.5
With adult male elephant tusks weighing roughly 135 pounds, and adult female tusks weighing 20 pounds, a single elephant tusk can sell for $20,000 to $175,500 on the Asian market.6 Groups involved in the smuggling of tusks from Africa to Asia pocket the majority of this revenue, as they pay regional poachers around $23 per pound (or $50 per kilo) and then sell the same tusk to middlemen for roughly $200 per kilo.7
Garamba National Park Overview
For Garamba’s rangers, tracking poachers through the vast park is daunting and dangerous. The Park itself spans an area of about 4,920 square kilometers. This includes the three hunting reserves on its borders, and the complex covers more than 12,000 square kilometers, an area the size of the U.S. state of Connecticut and slightly larger than the Gambia. Park rangers must track migratory elephant herds through savanna grasslands and deep forests and they must stop elusive groups of poachers who use their intimate knowledge of the terrain to escape detection. (Please see Figure 1)
Key Findings + Recommendations
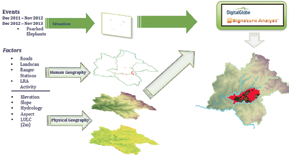
In an effort to help park rangers focus their patrol efforts on the areas with the greatest probability of a poaching incident, DigitalGlobe analysts were given the geospatial locations and dates of elephant remains discovered between 2011 and 2013. Analysts also received elephant collar data, ranger patrol routes, and past Lord’s Resistance Army (LRA) camp locations.
This data allowed DigitalGlobe analysts to conduct historical geospatial trend analysis, cost surface travel analysis, key terrain analysis, and predictive analysis based on output from the Signature Analyst™ geospatial terrain analysis tool. The following are the team’s key findings:
• Collar data from 2011 - 2013 indicates there was no clear seasonal elephant migration but there were four primary areas where elephants tended to cluster. * Although data from only 19 out of an estimated 2,400 elephants does not represent a statistically relevant sample size, it does represent the best data available on Garamba’s elephants and their patterns of movement.
• Elephants tended to remain in the same primary areas of the park, and very few traveled to the northern portion of the park or into other
cluster areas.
• Due to the lack of data in the northern portion of the park, it is difficult to determine if there is a significant poaching threat in that area of the park. Of the three collared elephants that did travel to the northern portion of the park, two returned unharmed, and the GPS collar of one elephant stopped transmitting while it was still in the north.
• From 2011 to 2013, all reported elephant poaching incidents took place within the same 1,818 km² area of the park which can be further divided into four distinct poaching areas of operation (each less than 480 km²).
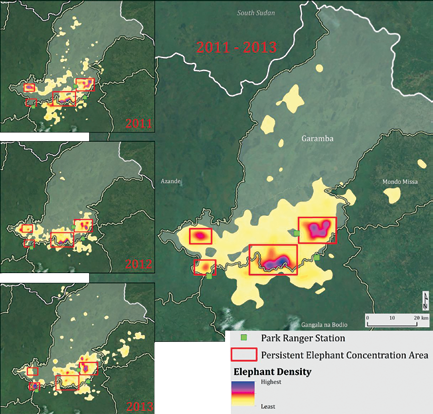
Figure 2.
*It is likely that there were some poaching incidents outside of this area, but because the rangers do not commonly patrol the northern portion of the park, no incidents have been reported north of the Garamba River.
• 50 percent of all the poaching events that took place in 2013 were within five kilometers of a 2012 event, which indicates that poachers are utilizing the same areas of the park from one year to the next.
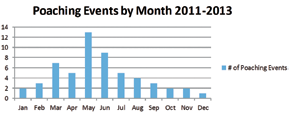
• Between 2012 and 2013 there was a significant (55 percent) decrease in the number of poaching events within the park. This was particularly apparent in the eastern portion of the poaching area where a 76 percent decrease in poaching events was observed. Since that time, in 2014, the number of poaching events increased dramatically throughout the park.
• The Signature Analyst™ tool further reduced the probable poaching area of operations to four areas of less than 32km² (this represents a 98 percent reduction in the overall park and a 95 percent reduction within the historic poaching zone) and one possible new area should poaching in historical areas be disrupted.
In an effort to combat the poaching, rangers have increased both the number of patrols they are conducting and their patrol ranges (from seven kilometers in 2012 to 15 kilometers in 2013). Although these efforts appear to have had an effect in the eastern portion of the poaching areas, they have had a minimal impact in the western areas where the number of poaching events remains consistent.
• Ranger patrol data for 2013 and for January to March of 2014 indicates that park rangers are primarily sticking to the secondary road network in the western portion of the primary poaching areas of operation. These secondary roads are likely useful to the poachers as a means to reconnect with the primary road network, but poaching events generally take place approximately 3.5 kilometers from a secondary road.
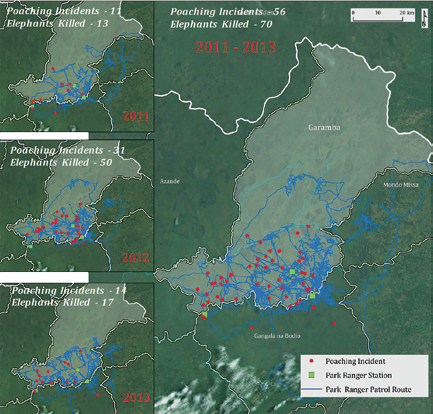
Figure 3.
• Establishing random checkpoints or inspection stations at key choke points into and out of the poaching areas, particularly during the high poaching months from March to August will likely provide the rangers with a better means of controlling who travels into these areas.
• Only 45 percent of all patrols from 2013 to March 2104 have been within five kilometers of a historic poaching event, and only 15 percent have been in an area identified as highly likely to have a poaching incident by the Signature Analyst™ output. Focusing patrols in these areas will likely increase the rangers’ odds of disrupting the poachers’ areas of operation.
Elephant Movement
DigitalGlobe analyzed collar data provided by African Parks for 19 different elephants. Although each indvidual elephant’s movements likely represent those of a larger herd, the data is a small sample of the overall number of elephants within Garamba National Park.
The 19 collars transmitted location data for different lengths of time and at different periods of time from 2011 to 2013. Only two of the elephants transmitted locational data for 17 to 20 months, which allowed for wet (June to November) and dry (December to May) seasonal migratory analysis. No clear seasonal migration was detectable in the available collar data. However, in the three-year study period, elephants tended to cluster in four primary areas in the southern portion of the park.
Figure 2 depicts the persistent cluster areas from 2011 to 2013, followed by a temporal depiction of where collared elephant concentrations could be found during the study time frame.
Patrol + Poaching Incidents In The Southern Region Of Garamba
Similar to the elephant collar data, park ranger patrol information is most prevalent in the southern portion of the park. Park rangers rarely traveled north of Garamba River from 2011 to 2013. However, recent efforts are being made by the park to patrol northern areas more extensively by utilizing helicopters.8
The number of poaching incidents that have occurred in the northern section is unknown at the time of this report. The available data revealed that there were 56 known poaching incidents resulting in 70 elephant deaths. Since April 2014, there have been at least 131 elephants killed by poachers.9 (Please see Figure 3.)
Historical Trend Analysis Within Garamba National Park, 2011 To 2013
From 2011 to 2013, there were 56 elephant kill sites discovered within 56 kilometers of each other in Garamba National Park. Covered by vast grassland, and surrounded by the parks gallery forests to the south, east, and west, the ~1,818 km² area represents the park’s primary elephant poaching zone.
Within this zone, there are four distinct poaching areas of operation (AOs), described below. Poachers generally tended to stay away from significant elephant concentrations, and they operate in areas more than seven kilometers from park ranger stations.
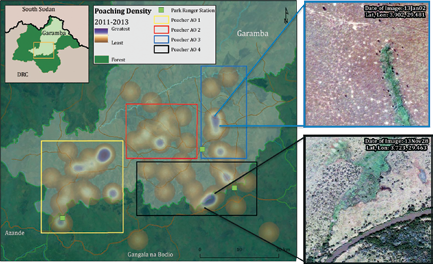
Figure 4.
Poaching Areas of Operation:
• AO 1—This (480 km²) area has been the most active overall for poaching, accounting for 33 percent of all 2011- 2013 poaching activity. Ranger patrolling data from 2012nt) and Febrary to
• AO 2—This 246 km² area has been frequented by poachers over multiple years, representing 23 percent of all poachingevents, with the majority of events (76 percent) takingplace from March to June.
• AO 3—Although AO 3 (268 km²) accounts for 21 percent of all poaching activity in the park from 2011 to 2013, only one poaching event took place in 2013, suggesting that increased ranger patrols in this area have pushed the poachers into other areas. Analysis found that the one incident in 2013 took place in the same month and only five kilometers awayfrom an incidenta yearearlier, which may indicate an annual hunter.
• AO 4—As is the case with AO 3, AO 4 (411 km²) had significantly less activity in 2013 than it had in 2012. The two events that took place in 2013 were shifted further to the west than in previous years. (Figure 4.)
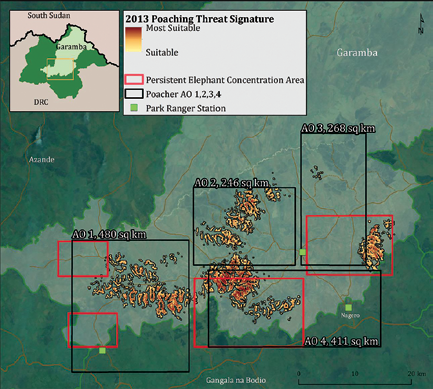
Figure 5.
Signature Analyst™ Methodology
DigitalGlobe used Signature Analyst™ software to identify geographically suitable terrain for poaching activity. The model measures the relationship between elephant poaching sites and geospatial data, or factors, within the area of investigation to identify other similar terrain in the environment.
Signature Analyst™ Poaching Signature Within Garamba National Park
Using an advanced geospatial terrain analysis tool (Signature Analyst™) DigitalGlobe analysts were able to further refine the most susceptible areas for poaching activity within each of the four poaching area of operations and were able to identify a new area that shares a similar geospatial signature with historic hot spots. (Please see the image above at left.)
The total area reduction represents a 98 percent reduction in the overall park and a 95 percent reduction within the historic poaching zone. In 2013, poaching tended to occur within grasslands, away from elephant concentrations (within AO 1 and 2), on the outskirts of gallery forest areas, above 740 meters of elevation and fivekilometers from discovered LRA camps.
There was a significant stand-off distance from park ranger stations in 2013, generally occurring over 12 kilometers away, which is an increase from 2012 when they were generally seven kilometers away. Poaching is also generally 3.5 kilometers from a secondary road network. (Please see Figure 5.)
* Historical poaching area compared to geospatially reduced area:
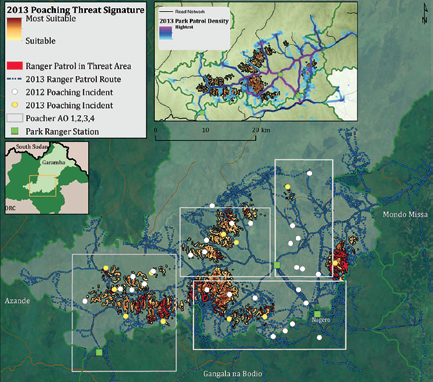
Figure 6.
AO 1 (480 km²) – 31.6 km² of Signature
AO 2 (246 km²) – 26 km² of Signature
AO 3 (268 km²) – 2.3 km² of Signature
AO 4 (411 km²) – 29 km² of Signature
* Area of interest based off shared signature is 107 km² 9
Garamba National Park Ranger Patrol Data
In an effort to combat poaching, rangers have increased both the number of patrols they are conducting and their patrol range (from seven kilometers in 2012 to 15 kilometers in 2013), which appears to have had a positive effect in the eastern portion of the park.
However, in the western portion of the poaching areas, the number of poached elephants remained essentially the same from 2011 to 2013. This is likely due to the fact that the rangers who are patrolling these areas are primarily sticking to the secondary road network, and poaching events are taking place between the road networks and generally at least 3.5 kilometers from a secondary road.
* Throughout all of 2013, only 45 percent of all patrols have been within five kilometers of a historic poaching event, and only 15 percent of the events have been in an area identified as highly likely to have a poaching incident by the Signature Analyst™ output.
2014 Patrol Data
In January and March of 2014, park rangers had only directly patrolled 5 percent of the 107 km² Signature Analyst™ output. As in 2013, patrols in this area have not often strayed from the secondary road networks. Updated patrol route information since March of 2014 could be used to identify if there have been recent changes in these patrol patterns. (Please see Figure 6.)
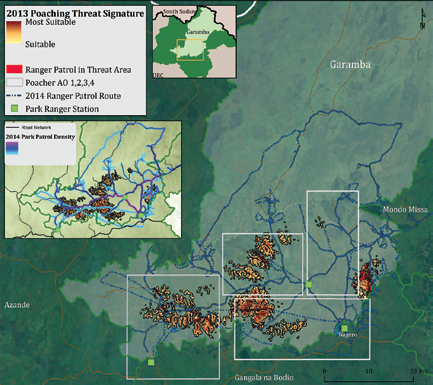
Figure 7.
Cost Surface Analysis Of Garamba National Park
The choke points identified represent terrain that poachers may use to move ivory undetected out of Garamba National Park. Establishing random checkpoints or inspection stations at key choke points into and out of the poaching areas will likely provide the rangers with a better means of controlling who travels into these areas.
Cost surface analysis is a rule-based model that represents an additional capability DigitalGlobe provides. Further refinement using park ranger input would optimize the model to a higher confidence level and can change results. It is unknown whether the waterways or road networks are utilized by the poachers.
Five choke points were identified using the following assumptions:
• Land movement: Poachers will primarily utilize the road network, and then they opt for minimum slope and stand-off distances of 10 kilometers from park ranger stations.
• Stream/River movement: Poachers will use waterways when available, and then they opt for minimum slope and keeping stand-off distances of 10 kilometers from park ranger stations.
(Please see Figure 8.)
Key Choke Point Description
The chokepoints identified represent terrain that poachers will likely pass through to reconnect with the primary road networks either, on the way into or out of poaching areas of operation. (AO)
• Chokepoint 1—This area’s close proximity to AO 1 and optimal stand-off distance from the nearest ranger station suggests it is highly likely that this route is commonly used by poachers to return to the improved road network when exiting the park to the west. It is unknown whether this is a river crossing point. However, the availability of flat embankments make this location an ideal staging area for ship-to-land transfers.
• Chokepoint 2—This area is a grassland/waterway for movement throughout the park.
• Chokepoint 3—This area serves as the primary convergent point for multiple avenues of approach. The area serves as the primary southern exit point, is primarily forest-covered, and there is no park ranger station to repel freedom of movement in this area which should be key terrain for park rangers.
• Chokepoint 4—This is the intersection of all but one of the 2013 poaching locations for land movement paths heading north. This location is just south of a region of the park that rangers do not patrol, according to 2012
patrol data.
• Chokepoint 5—As routes disperse to bypass the Nagero station at a safe distance and head east, this pass through to return to the improved road.
Garamba’s park rangers have improved upon the annual number of patrols they are making, and they have signifiantly increased their patrol distances from the ranger stations (particularly in the eastern areas of the park which saw a dramatic decrease in the number of poaching events between 2012 and 2013).
There are, however, still some focus areas that they have been missing. Rangers could have greater impact in countering poachers operating in the park if rangers gathered data on the northern portion of the park, refocused patrols into the Signature Analyst™ areas where poaching events are more likely to occur, and controled key access points into and out of the poaching areas.
The findings of this report could assist Garamba’s rangers in targeting and timing their patrols to better protect the park’s elephants from poachers. If the application of the predictive analysis demonstrated here does help to slow the slaughter of elephants, the analytical method and tools could be used elsewhere in Africa to stem the increasingly rapid slaughter that is taking a heavy toll on the continent’s elephant population.
Analytical approaches such as these should be part of a larger multifaceted effort undertaken by governments, African civil society organizations, international bodies, conservation groups, and anti-atrocity organizations to stop poaching. The concerted efforts of many involve halting the poaching in Africa and also ending the demand for ivory.
One example of multinational efforts to counter poaching is the recent deployment of U.S. Marines to Chad to train park rangers to intercept elephant poachers. DigitalGlobe, the Satellite Sentinel Project, and the Enough Project hope that this pilot initiative can make a measurable contribution to that effort.
Update
Since April of 2014, at least 131 elephants have been poached within Garamba National Park. Although DigitalGlobe was not able to obtain the precise locations for every poaching event, results from the modeling of poaching trends allow patrols to focus on the highest likelihood or probability threat areas. This translates to a 95 percent area reduction where the majority of the recent poaching incidents have taken place.
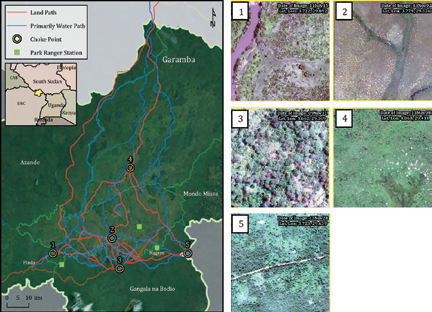
Figure 8.
Focusing the park’s increased security measures (including use of a charter helicopter, collaboration with U. S. Africa Command, and intensification of the parks surveillance aircraft) in the reduced areas would allow for greater patrol focus on the most likely areas for poaching events.
Editor’s note: Our thanks to DigitalGlobe for permission to repurpose their article from their infosite. All imagery is also courtesy of DigitalGlobe.
References
1 Interviewwith African Parks, January 23, 2015.
2 African Parks, “The Poaching Crisis in Garamba,” briefing paper on file with the Enough Project.
3 African Parks and the Institut Congolais pour la Conservationde la Nature, “African Parks and ICCN Respondto Poaching Onslaught in Garamba National Park, DRC,” Press release, June 12, 2014.
4 Kasper Agger and Jonathan Hutson, “Kony’s Ivory: How Elephant Poachingin Congo Helps Support the Lord’s Resistance Army,” (Washington: the Enough Project, 2013), available at http://www.enoughproject.org/files/KonysIvory.pdf.
5 In the pastyear, elephant tusks have been estimatedto sell in Asia at roughly $1,000 to $1,300 per pound. This estimate varies widely with some reports estimatinga tuskselling for higher than $3,000 per pound. The price is also dependenton the quality of tusks with forestelephant tusks in the higher range due to their pinkish hue. See MaxFisher, “Obama wants tocurb Africa’s ivory trade. Here’s what he’s upagainst.” Washington Post, July 1, 2013, available at http://www.washingtonpost.com/blogs/worldviews/wp/2013/07/01/obama-wants-to -curb-africas-ivory-trade-heres-what-hes- up-against/; Chelsea Clinton, “How We Can End the Elephant Poaching Crisis,” Clinton Foundation blog, August 19, 2013, available at http://www.clintonfoundation.org/main/clinton-foundation-blog.html/2013/08/19/how-we-can-end-the-elephant- poaching-crisis/; Dan Levin, “The Price of Ivory: FromElephants’ Mouths, an Illicit Trail to China,” The New York Times, March 1, 2013, available at http://www.nytimes .com/2013/03/02/world/asia/an-illicit-trail-of-african-ivory-to- china.html?pagewanted=all&_r=0; Agger and Hutson, “Kony’s Ivory”; Monica Medina, “The White Gold of Jihad,” The New York Times, September 30, 2013, available at http://www.nytimes .com/2013/10/01/opinion/the-white-gold-of- jihad.html.
6 Mike Loomis, “Key Characteristics of the African Elephant,”Field Trip Earth, available at http://www.fieldtripearth.org/article.xml?id=706 (last accessed January 2015); International Elephant Foundation, “African Elephants,” available at http://www.elephantconservation.org/elephants/african-elephants/ (last accessed January 2015).
7 Nir Kalron and Andrea Crosta, “Africa’s White Gold of Jihad: al-Shabaaband Conflict Ivory,” Elephant Action League, available at http://elephantleague.org/project/africas-white-gold-of-jihad-al-shabaab-and-conflict-ivory/.
8 Cynthia Walley, “Update: Garamba National Parks Poaching Crisis,” African Parks, September 1, 2014, available at http://www.african-parks.org/Blog_150_Update percent3A+Garamba+National+Parks+Poaching+Cris is.html.
9 Interview with African Parks, January 23, 2015.