A key part of any business plan involving satellites is the ability to estimate potential income for the mission—this task is just as important for investors doing due-diligence on a new company as it is for large established companies deciding on a new program.
Estimating income, however, is a complex problem due to relationships between the customer products, the satellite’s ability to deliver and the planned orbits. A change in any one of these three categories can affect the others and can greatly affect the profitability of the mission as well.
This article shows how to use the Predictive Ground Station Project (a.k.a., “PIGI”) to map these relationships and quickly estimate a mission’s income potential during the conceptual design stage. The approach is mapped within the context of a workshop for entrepreneurs and universities, delivered as a competition.
Participants are given some constraints—a $2.5 million budget to ‘purchase’ satellites and infrastructure, modeled in PIGI, and must balance strategically the impact of spending more money on ground infrastructure vs. more money on satellites. The Participant with the most profitable mission profile wins the competition and receives a small award, chocolate for the younglings, or a bottle of wine for
older participants.

About PIGI
PIGI is mission control and simulation software developed by Saber Astronautics which uses video game technology to enable people to operate large numbers of satellites with very little training. The science behind video game technology is a mix of computer science and human factors. Commercial studios compete heavily in making games which allow people to handle large complex tasks with the greatest speed and minimal training.
PIGI represents ongoing research applying the same principles to space operations. There are two reasons why this is important today.
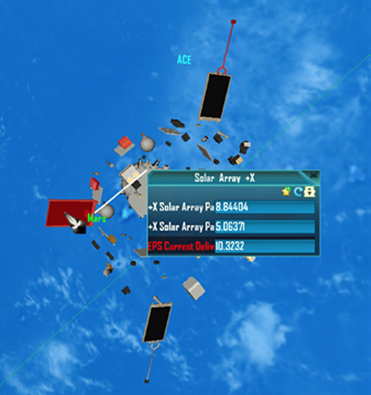
First, the complexity of spacecraft data has steadily increased over the last two decades. Modern designs are calling for greater fidelity of health with increased number of telemetry items requiring tracking. For example, the 560 kg NASA Advanced Composition Explorer (NASA ACE) satellite, launched in 1997, operates on 1,600 telemetry words, updating every 16 seconds. Twenty years later, there are many commercial satellites of one-fifth the mass of the NASA ACE which demand 6,000 telemetry words, updating at 1 Hz. This increase in complexity is likely driven by better technology and greater demand for reliability. Faster computers and better communications mean that better health data is available.
Second is the growth in the number of NewSpace companies in the last three years, in particular, CubeSat missions. There are several trends to note—the costs of a CubeSat mission is fairly low, $150 to $250 thousand for a minimal viable product.
Space entrepreneurs are not necessarily from the space industry, and while most of these ventures have talented engineers, many are recent graduates or otherwise new to the field. This has resulted in a range of errors, sometimes affecting the flights, sometimes affecting the operations, and always affecting the pocketbook.
PIGI handles these two problems (complexity and training) by creating a single global simulation, data management, and user experience. Navigating the simulation is designed to be familiar to anyone practiced at playing first-person shooters.
Complex data, such as detailed telemetry, is abstracted by the graphics until the user needs it, i.e., via an alert system or on demand from the user. Also, similar to video games, much of PIGI’s ergonomics are meant to encourage self-training. The UI is icon rich and text is minimized where possible. Icons and other graphics were tested to be as intuitive as possible regardless of age, sex, or ethnicity of the user.
The simulation datasets include the Hipparcos star charts (~150,000 stars), magnetic field models, gravitational, and SGP4 orbital mechanics. Space weather integrated data is provided by the Space Environment Center (NOAA/SEC) and Australia’s Department of Meteorology. Users can import their own satellites using a Python driven CAD converter. Implemented in C++, PIGI is currently in Alpha-release PC and Mac.
Saber Astronautics started using the PIGI casual license in a range of entrepreneurial workshops last year as part of user testing. The workshops, designed for students/STEM, and entrepreneurs/enthusiasts uses a simple but effective ‘cookbook’ approach. The methods are simple enough for most people to participate but with high enough fidelity to give reasonable solutions suitable for feasibility studies or conceptual design missions.
Define Customer and Product
First, a set of customer requirements and space delivered products are defined. Conventional satellite products usually fall within the realm of space imagery, scientific data, or communications. Simple examples are the publicly available panchromatic photos transmitted by NOAA weather satellites or data transmissions relayed from a ground based IoT sensor. Workshop members define the use cases for the products and identify any impacts to spacecraft design. Of interest is the size of the product in bits and the location where their customers are regionally located.
The spacecraft SATCOM system is also considered, in particular calculating theoretical upper boundaries for data downlink rates. A simple approach is to use Shannon Information, which provides a theoretical limit to the capacity of channel.
The equation is high school level, so it is easy and quick; however, there are also limitations in estimating data rates. Shannon does not consider a full link budget analysis, multiple access requirements, losses, etc. Data header information and overheads, such as encoding, and check sums are also missing, so expansion ratio is applied. At early stage mission planning, SATCOM hardware has not been selected and much of this information is unknown, so a 2x ratio is often used.
Define Orbit and Overpasses
The next step is to calculate overpass duration and frequency. Overpass times are affected by orbital parameters and SATCOM beam widths. The customer is king, so the user experiences that they want are important here but requirements can quickly conflict.
For example, higher altitudes and larger beamwidths increase overpass durations and service areas. This will minimize out of service areas (service gaps). However, increased altitudes and large beamwidths are costly because they can reduce gain. The satellite will need a stronger EPS to close the link, which is especially challenging for CubeSat and microsat missions which are more power constrained.
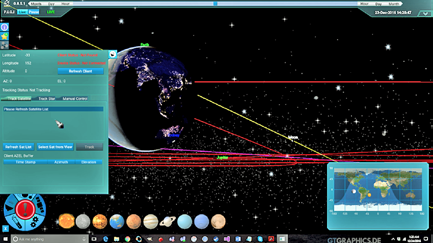
A user can add space assets in PIGI in one of three ways. They can load a TLE from the Satellite Catalog, manually enter a TLE from text, or enter the six orbital elements directly. Likewise, adding a new ground station is easy, via the SATCOM interface, entering the lat/long, station name, and beam width for the station. A lock/unlock button allows the user to modify beam widths and orbital parameters to experiment with different configurations and overpass times.
Saber also has a range of MATLAB scripts which enables the user to pre-generate constellations. This can be very useful for Monte Carlo testing and optimization of large 100+ satellite constellations.
Calculate Sum Overpass Times
The Time bar shows overpass information for each ground station, color-coded by satellite. The user can propagate forward or backwards in simulation time. Clicking on the ground station label shows a list of overpasses for that site which can be exported to an excel spreadsheet.
Acquisition of Signal (AOS) and Loss of Signal (LOS) fractional Julian Dates are saved for each overpass for each satellite in the constellation. Overpass duration and gap durations are easily calculated from AOS and LOS times.
Duration of a single overpass in seconds is simply the difference between AOS and LOS for that pass. Gap duration is the difference between AOS for the given satellite and LOS for the prior satellite. Satellites which overlap are represented as zero gap time, however satellites overlapping a given area is also inefficient.
Estimate Potential Volume
At this point in the workshop, the mission planners know a size of product for downlinking, the maximum pipeline given by the SATCOM systems, and the effects of their mission simulation from PIGI. Summing the overpasses in seconds gives the pipeline available for a single day. Dividing this number by the product size gives the number of products downloaded on that day. The planner can simply multiply this number by 365 days to give an annual potential volume of products for that mission and experiment with a price point per product to estimate maximum potential sales revenue.
It is important to note that this method is simplistic and results in a maximum possible revenue. “Maximum” in this context means that every data bit downlinked from the constellation is sold at the cost provided. More realistic ways to temper this number will depend a great deal on the use cases provided by the mission.
However, the outputs can provide important insight supporting conceptual design stage. Onboard memory volume requirements, for example, can be estimated from summing the gap times. With properly constructed SATCOM specifications (rather than simple Shannon Information). Saber was able to quickly optimize orbits for large constellations of 100+ satellites and validate a mission plan. This provided key evidence for a customer under due diligence to earn their Series-A investment.
One of the problems with spaceflight software is that it is bespoke. Operators need a wide range of features, from dish control to diagnostics, in order to be effective. Many of these features are usually a mash of varying text based tools from different sources.
As one engineer exclaimed, “You have to learn to knead your own bread in order to make a sandwich.” PIGI aims to solve this problem with integrated tools and easy-to-use interfaces.
The combination enables the ‘democratization’ of space so people with less formal training can plan their missions, approach investors, and quickly add their talent to our industry.
saberastro.com/

Prior to founding Saber Astronautics, Dr. Held was a US Army Major and team leader for USSTRATCOM (formerly Space Command) and deployed internationally in support of military space missions. He was a lead instructor at the Interservice Space Fundamentals Course and an engineer at Army Space and Missile Command Battle Lab. He conducted flight software for the Wide Field Camera 3 of the Hubble Space Telescope and testing for the International Space Station. He also conducted testing for an invasive class II medical device.
Dr. Held guest lectured for the IRS Space Station Design Workshop, University of New South Wales, and International Space University. He led a research expedition in the high Canadian Arctic and co-founded the Delta-V Startup Accelerator and the University of Sydney space engineering laboratory.